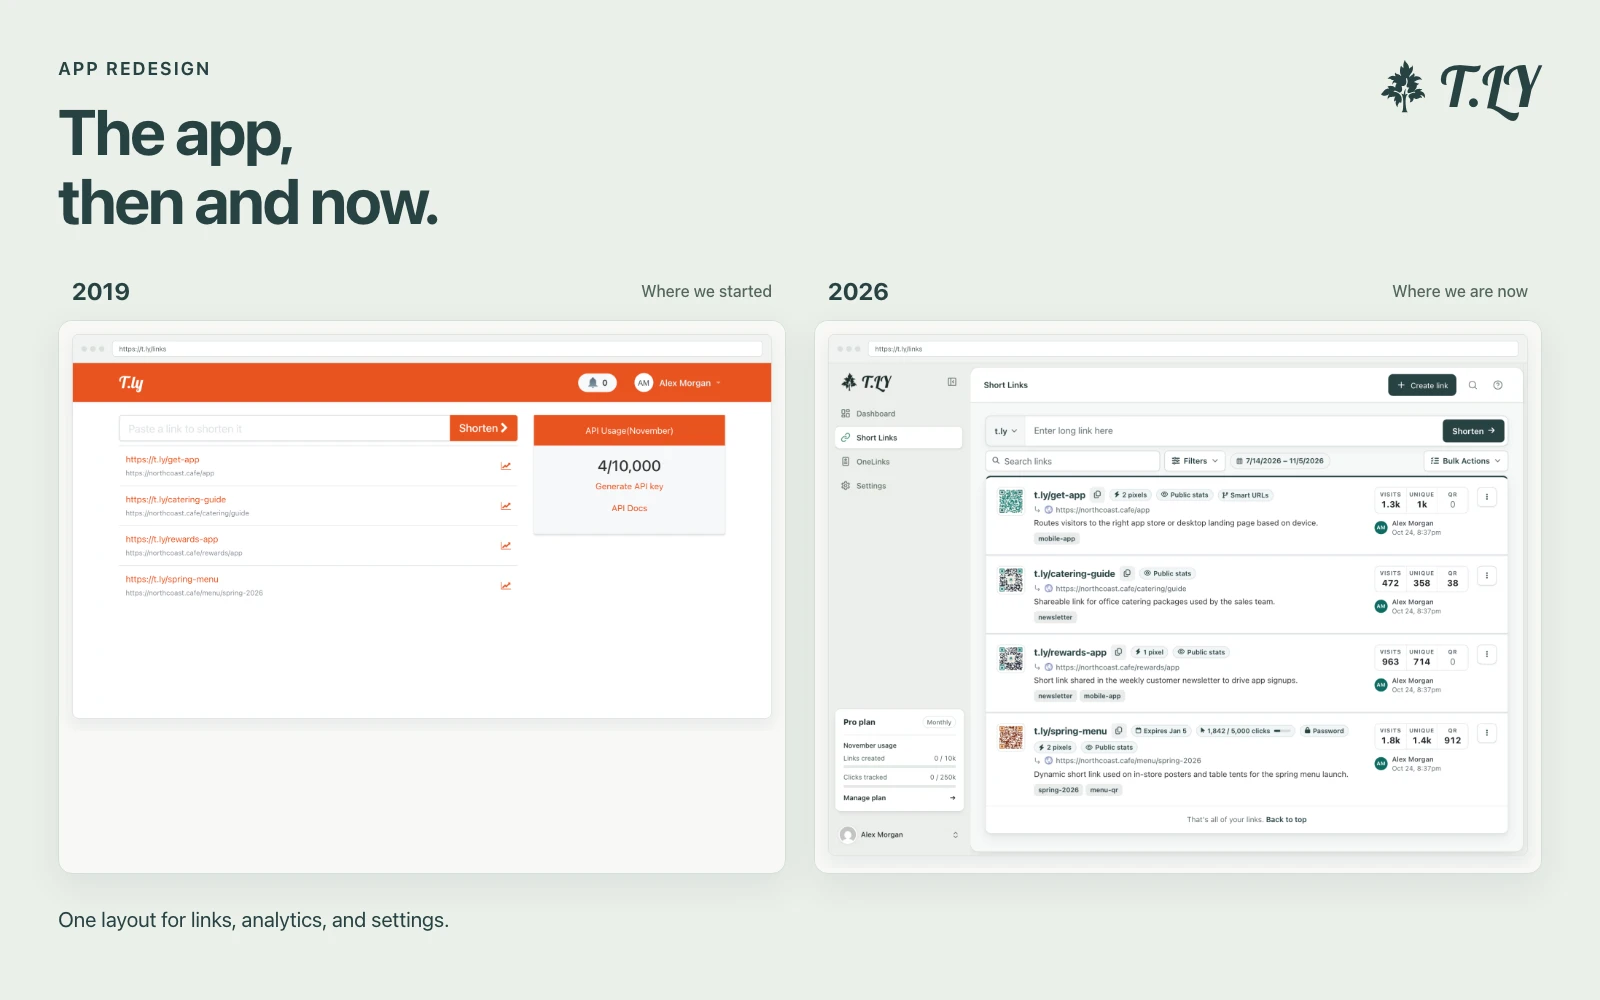
A New Layout for the T.LY App
T.LY has a new app layout, with a shared sidebar, search, clearer settings, and navigation that works on phones. Here’s what changed and where we started.
Format and summarize SQL Server STATISTICS IO/TIME output.
The SQL Statistics Parser turns noisy SQL Server SET STATISTICS IO/TIME ON output into a clean, readable summary.
It aggregates reads and timing so you can quickly spot which statements and tables drive the most I/O.
SET STATISTICS IO ON;
SET STATISTICS TIME ON;
-- your query hereAll parsing happens in your browser — no data is uploaded or stored.
T.LY has a new app layout, with a shared sidebar, search, clearer settings, and navigation that works on phones. Here’s what changed and where we started.
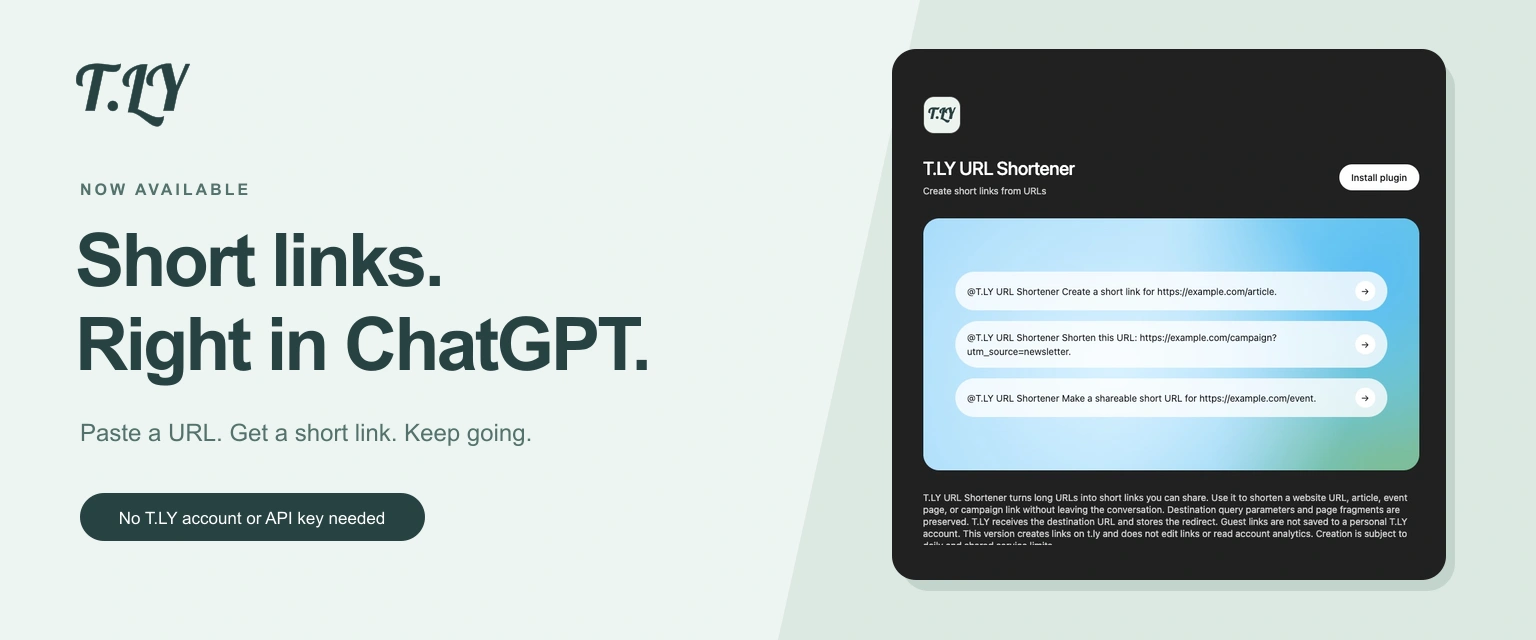
Create a short link without leaving ChatGPT. Install T.LY, paste your URL, and get a link you can share. No T.LY account or API key needed.
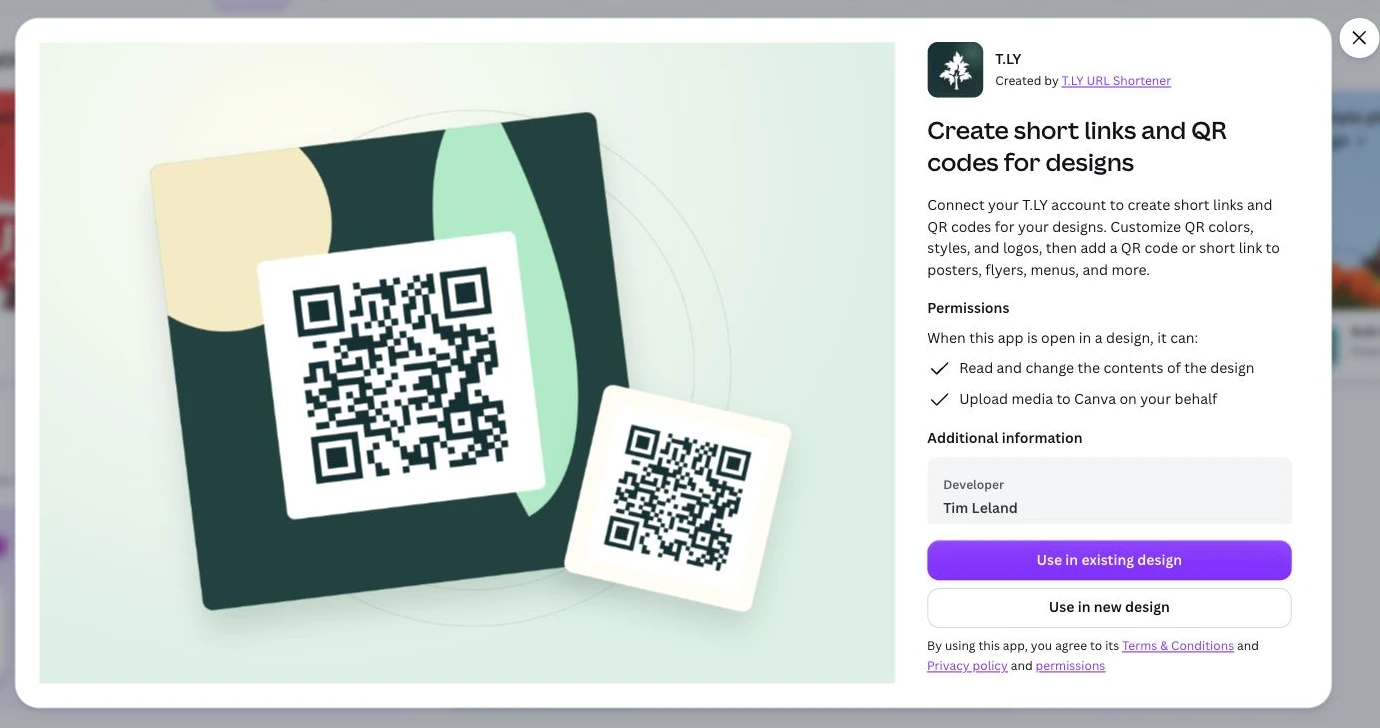
Create short links and branded QR codes inside Canva. Connect your T.LY account, customize your QR code, and add it to your next flyer, menu, or poster.